Visualize your place in the food supply chain. Add your organization or business, and gain access to a grassroots, data-driven supply chain management tool, developed in partnership with Canadian educational institutions, economic agencies, and food security organizations.
Returning ‘Circular Insights’ users! Your email address and password remain the same. You can sign in to foodsupplychain.ca using the same email and password used for circularinsights.ca. If you’ve forgotten either, use the ‘Lost Password’ button or contact us 7 days / week at, support@trugis.ca.
This is a collaborative space for stakeholders in the local food industry, encompassing producers, retailers, non-profits, and other key players. It offers a platform to work together beyond traditional silos, with minimal barriers.The foodsupplychain.ca platform consolidates real-time, crowdsourced data from members into interactive visualizations, offering a comprehensive view of the food supply chain adaptable to any scale. Designed for versatility, it supports various products, processes, and organizational sizes, providing insights into rural supply chains for effective decision-making. Beneficial for a broad spectrum of stakeholders, including consumers, producers, retailers, and more, its implementation is bolstered by partnerships with food policy councils, economic development agencies, educational institutions, and government bodies.
In rural regions, particularly with local food systems, organizations often encounter obstacles in acquiring and utilizing complex relational data. The conventional methods used for collecting supply chain data are typically tailored to specific industries or professions, characterized by their complexity and lack user-friendly, accessible interfaces.
This lack of a unified platform creates a barrier to effective collaboration and inclusivity among organizations within the food industry. It also makes it difficult to act on data which is missing the grassroots, local granular data which makes up a large portion of food supply chains in rural Canada.
Interactive supply chain modelling systems remove each of those barriers, making advanced decision-making tools a reality for rural Canada. They create a shared space for collaboration across different industries and regions. They also serve as a free tool for individual producers to monitor and manage their supply chains, regardless of scale or industry, all within the context of their community.

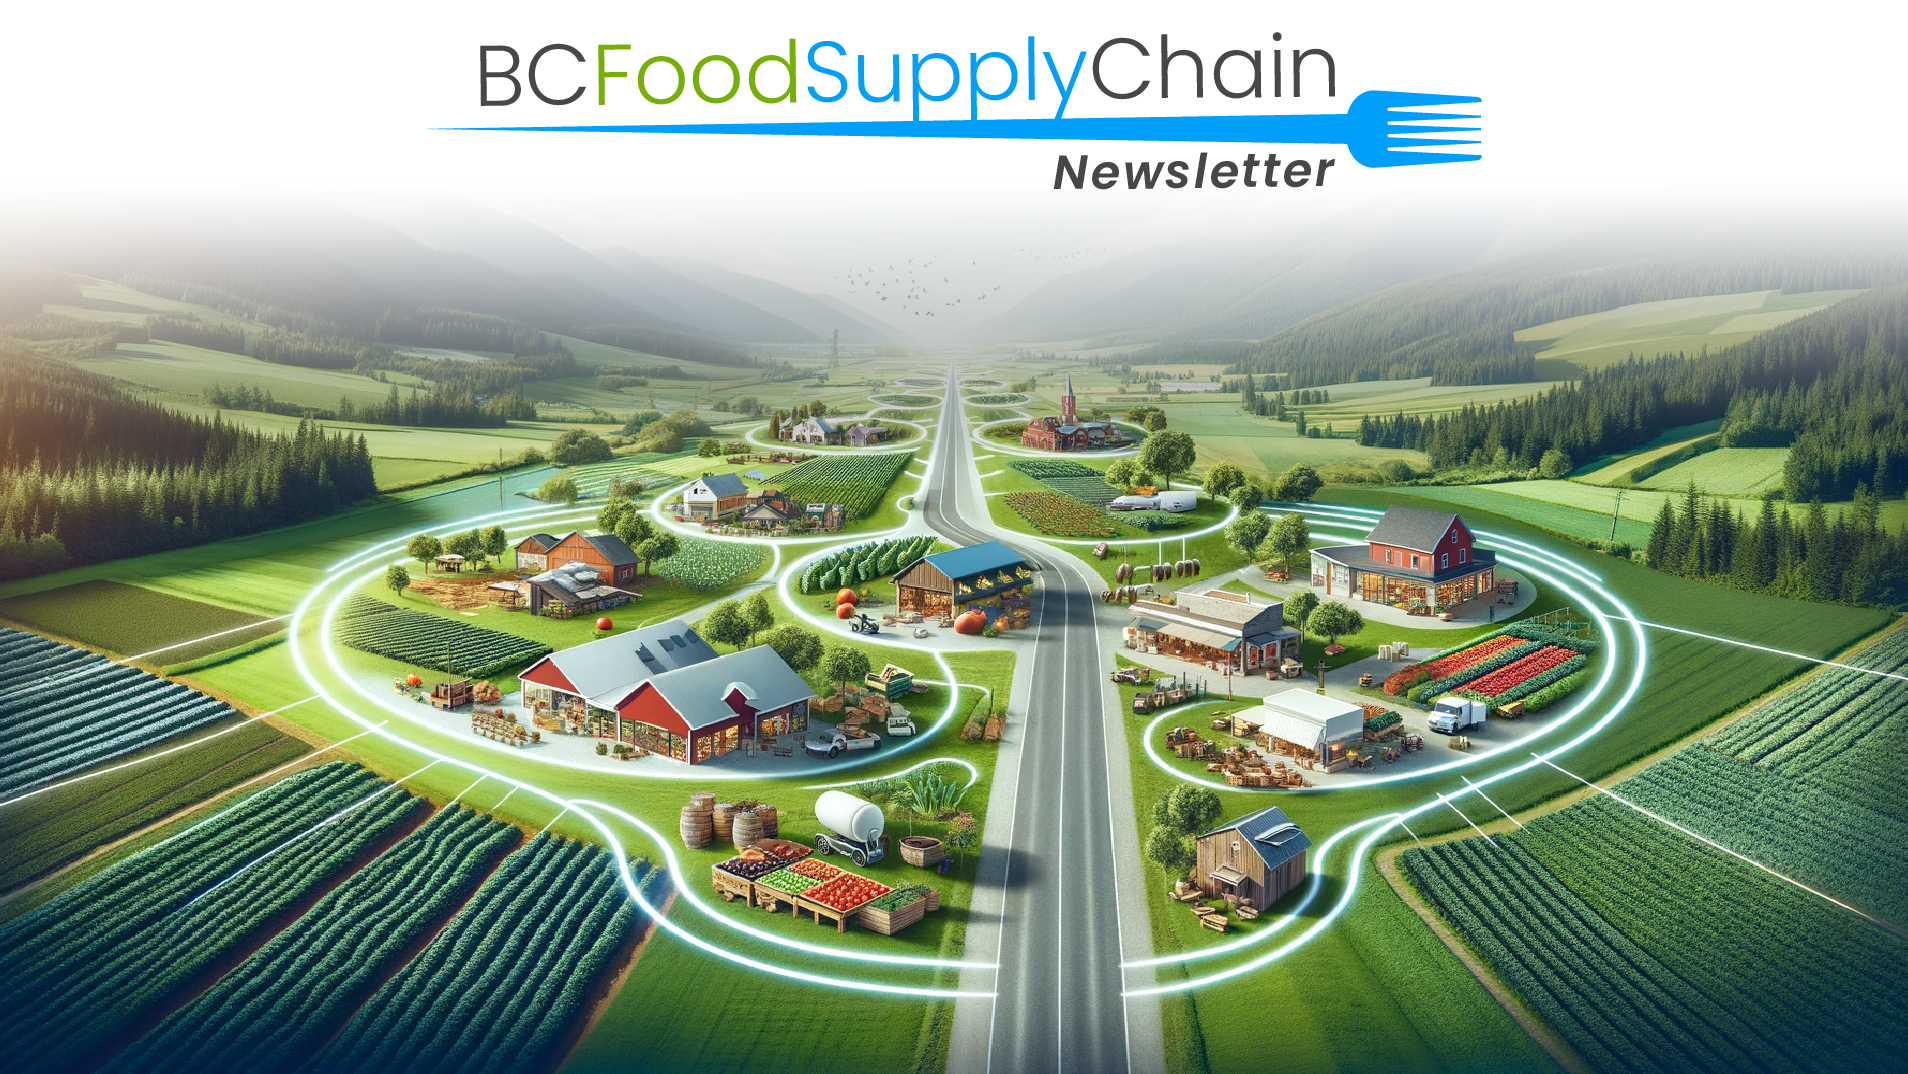
The BC Food Supply Chain Newsletter is an upcoming quarterly release sent to participants in the BC Food Supply Chain Platform, as well as stakeholders in the local food industry, ranging from producers to retailers to institutions. Each edition will highlight a variety of local organizations, regardless of their size, to bring awareness to the often hidden elements, challenges, and opportunities of our local food industry.
The questionnaire linked below is designed to help us better understand your organization and the specific challenges it faces in relation to the food supply chain, with the aim of including your insights in the newsletter.
Any information you provide may also be utilized to make improvements to the current platform, promote your organization, help stakeholders and decision makers understand your challenges, and promote your community’s role in the local food industry. So, feel free to be as detailed as you like!
What types of organizations should be added?
If you’re involved in the food industry in BC, you’re likely a valuable addition to the model. If you fall into any of these categories, the platform has been created with you in mind.
What are the benefits to your organization?
This project is being developed to meet the needs of stakeholders in the local food and food transportation sectors. The highest priority is to address inefficiencies in our supply chain and local food production. Besides diagnosing inefficiencies, organizations can expect a number of additional benefits:
Who created the food model?
The platform began with a small test region in southern BC in 2021. Planning, design, and early implementation were a fruitful collaborative effort between TruGIS Web & Geospatial Services, and the Lower Columbia Initiatives Corporation. The project has since evolved and grown, responding to feedback and incorporating greater technical sophistication. The platform now enjoys the support and/or partnership of multiple stakeholders with extensive expertise and experience within the food industry and beyond. These include the University of Guelph, Selkirk Innovates, Social Sciences and Humanities Research Council of Canada, the Boundary Community Ventures Association, the Kamloops Food Policy Council, and the Central Kootenay Food Policy Council. The list of supporters will continue to grow over the next few years of development.
Can I remove my information?
Yes! Organizations can have their information removed from the food model at any time. As with any other component of the project, meeting the needs and expectations of our local organizations takes priority. If you have any questions or concerns, we will be happy to address them within 24 hours. This can include the removal of supply chain links, organization details, or your presence on the models altogether. Feel free to email, support@trugis.ca for assistance.